Why Standard Settings Fail Day Traders
Most traders start their journey with the default MACD settings of 12, 26, 9. While these are excellent for swing trading or identifying longer-term trends, they often lag significantly in the fast-paced world of day trading. By the time a standard MACD signals a crossover, the scalping opportunity might already be over.
Enter the MACD (3, 10, 16). Popularized by legendary trader Linda Raschke, this custom setting is designed to strip away the lag, offering a hyper-sensitive look at short-term momentum. In this tutorial, we will break down how to use this tool to snipe entries and exits with precision.
Decoding the 3-10-16 MACD Configuration
To use this indicator effectively, you must understand what the numbers actually represent and how they differ from the norm.
The Components Breakdown
The logic remains the same as a standard MACD, it measures the difference between two moving averages, but the periods are tightened significantly.
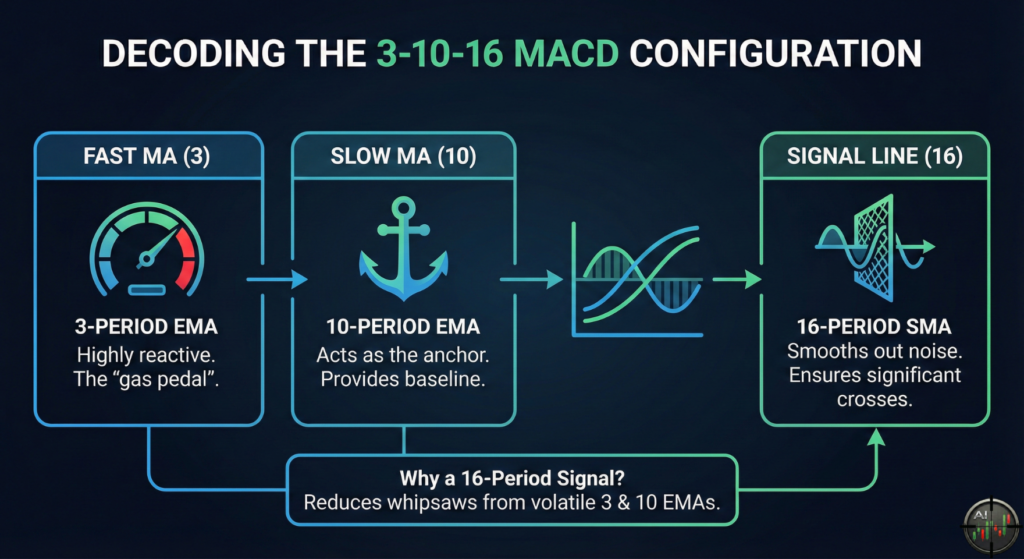
The Fast Moving Average (3)
The first number represents a 3-period Exponential Moving Average (EMA). This tracks price almost immediately. It is highly reactive to the last few candles, making it the “gas pedal” of the indicator.
The Slow Moving Average (10)
The second number is a 10-period EMA. This acts as the anchor. It is fast enough to adapt to intraday trends but slow enough to provide a baseline for the Fast MA to react against.
The Signal Line (16)
This is where the magic happens. Unlike the standard “9” signal line, this setting uses a 16-period Simple Moving Average of the MACD line.
Why a 16-Period Signal?
You might wonder why we use a slower signal line (16) for a faster indicator. Because the 3 and 10 EMAs are so volatile, using a short signal line would generate too many false positives (whipsaws). The 16-period smooths out the noise, ensuring that when a cross happens, it is statistically significant.
Core Trading Strategies: MACD (3, 10, 16)
Now that the indicator is set up, let’s look at the specific setups you should hunt for during your session.
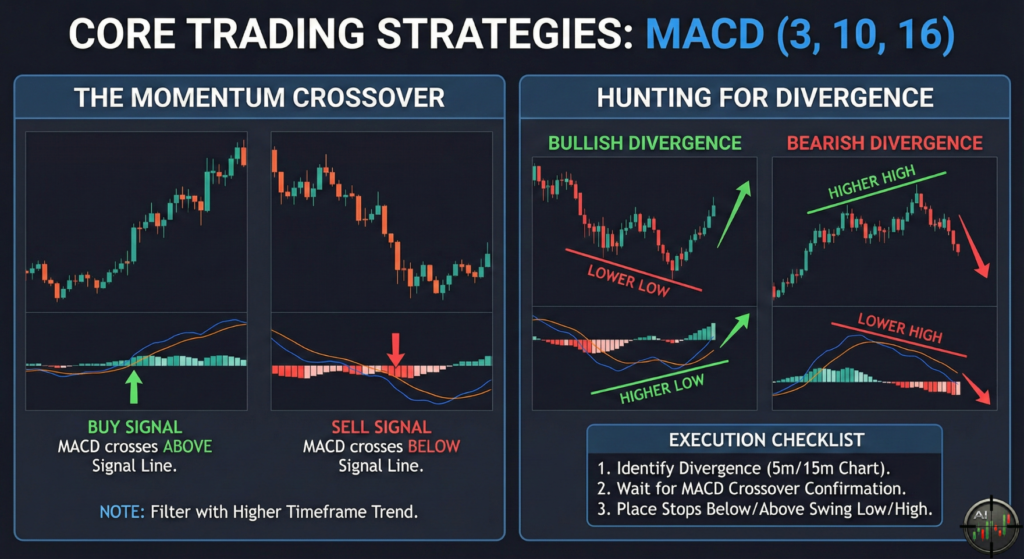
The Momentum Crossover
The most basic signal is the crossover, but with the 3-10-16, you are looking for specific conditions.
- Buy Signal: The MACD line crosses above the Signal line.
- Sell Signal: The MACD line crosses below the Signal line.
Note: Due to the sensitivity of the (3, 10) component, these crosses happen frequently. Filter these trades by only taking crosses that align with the higher timeframe trend.
Hunting for Divergence
This is arguably the most powerful way to use the 3-10-16. Because the indicator reacts so quickly to price, it visualizes loss of momentum long before price reverses.
Bullish Divergence
This occurs when price makes a lower low, but the MACD (3, 10, 16) makes a higher low. This indicates that sellers are exhausted, and a snap-back rally is imminent.
Bearish Divergence
Conversely, if price makes a higher high, but the MACD makes a lower high, the buyers are losing steam. This is a prime setup for a short position.
Execution Checklist for Divergence
- Identify the divergence on the 5-minute or 15-minute chart.
- Wait for the MACD line to cross the Signal line (confirmation).
- Place stops below the recent swing low (for buys) or above the swing high (for sells).
A Real-World Walkthrough: The “Sniper” Trade
Let’s put the theory into practice. We will walk through a theoretical trade scenario so you can see exactly how to combine these signals in real-time.
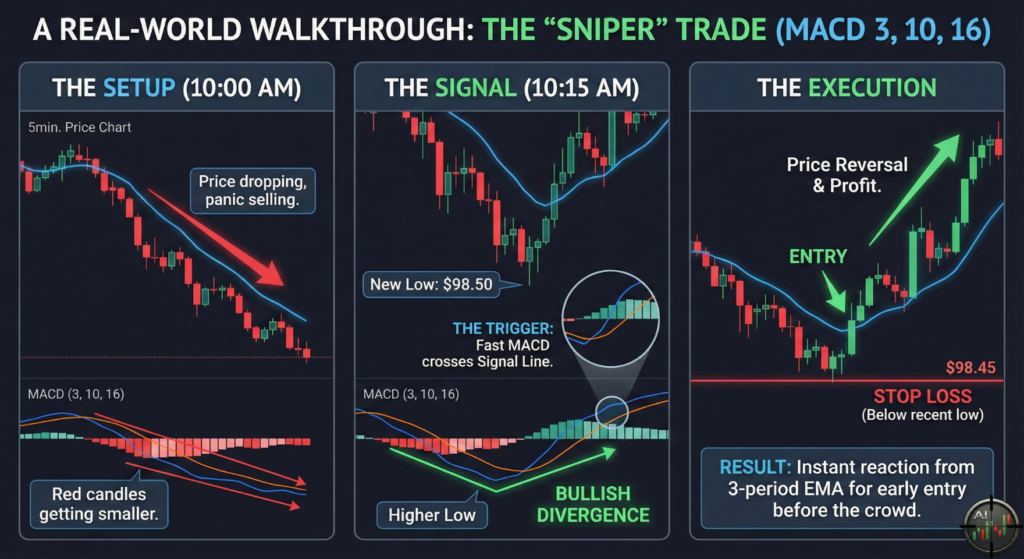
The Setup (10:00 AM)
Imagine you are watching a volatile asset on a 5-minute chart. The price has been dropping for the last hour. Most traders are panic selling, but you notice the red candles are getting smaller.
The Signal (10:15 AM)
You watch closely as the price action develops:
- Price Action: The price pushes down to make a new low of $98.50.
- Indicator Check: You look at your MACD (3,10,16). Even though price is at a new low, the MACD line is higher than it was on the previous dip 15 minutes ago. This is Bullish Divergence.
- The Trigger: Two candles later, the fast MACD line crosses up through the slower Signal line.
The Execution
- Entry: You enter a Long position immediately on the candle close following the crossover.
- Stop Loss: You place your stop loss at $98.45 (just below the recent low).
- Result: The 3-period EMA reacts instantly to the reversal, getting you into the trade long before the crowd who are using the slower standard MACD.
Platform Setup Guide
Getting this running on your chart is simple, regardless of whether you use TradingView, Binance, or other crypto exchange.
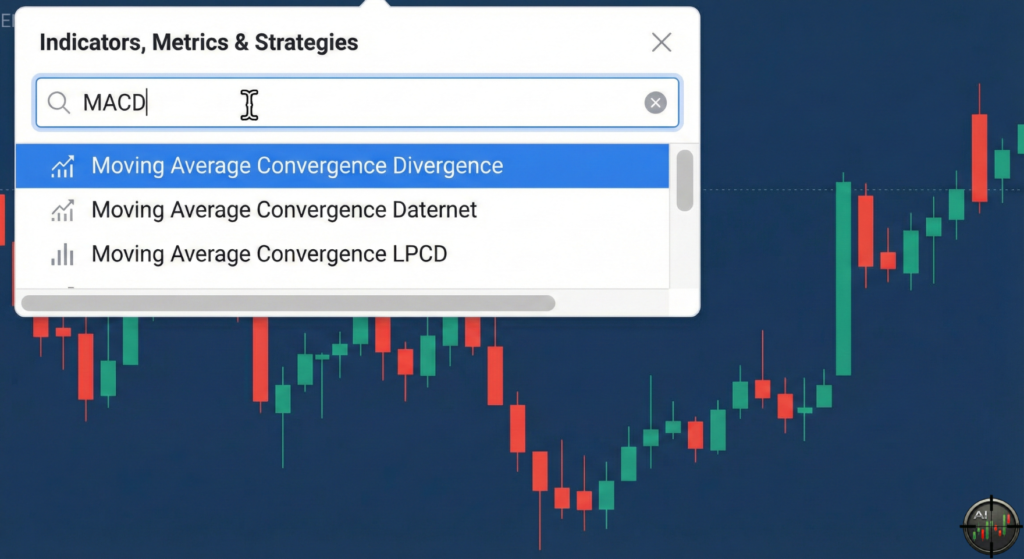
Step 1: Select the Indicator
First, open your platform’s indicator search bar and type “MACD”. Select the standard “Moving Average Convergence Divergence” from the list.
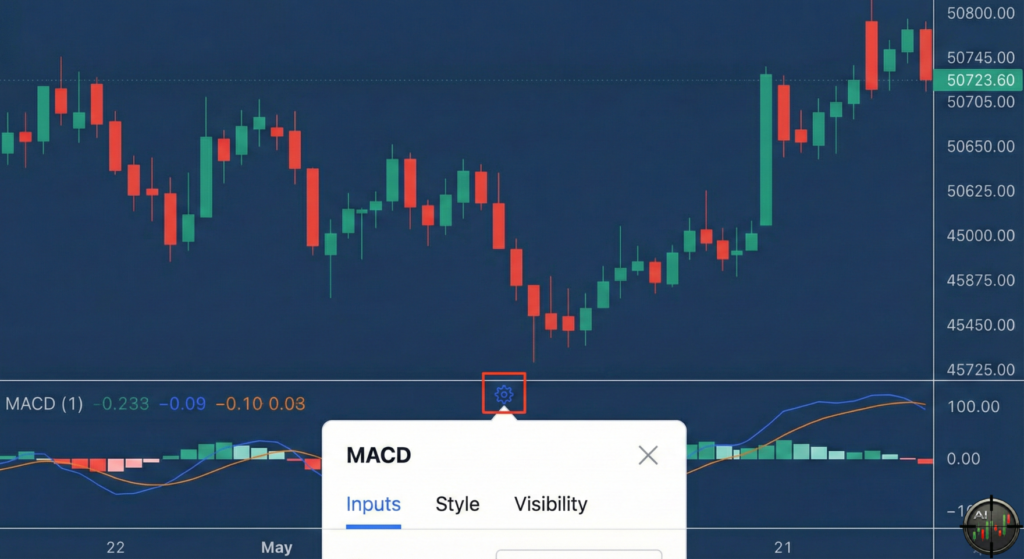
Step 2: Open the Settings
Once the indicator is on your chart, locate it (usually at the bottom). Click the gear icon or settings button on the indicator’s label to open its configuration window.
Step 3: Configure the Parameters
In the settings window (often under an “Inputs” tab), change the default values to the 3-10-16 strategy settings.
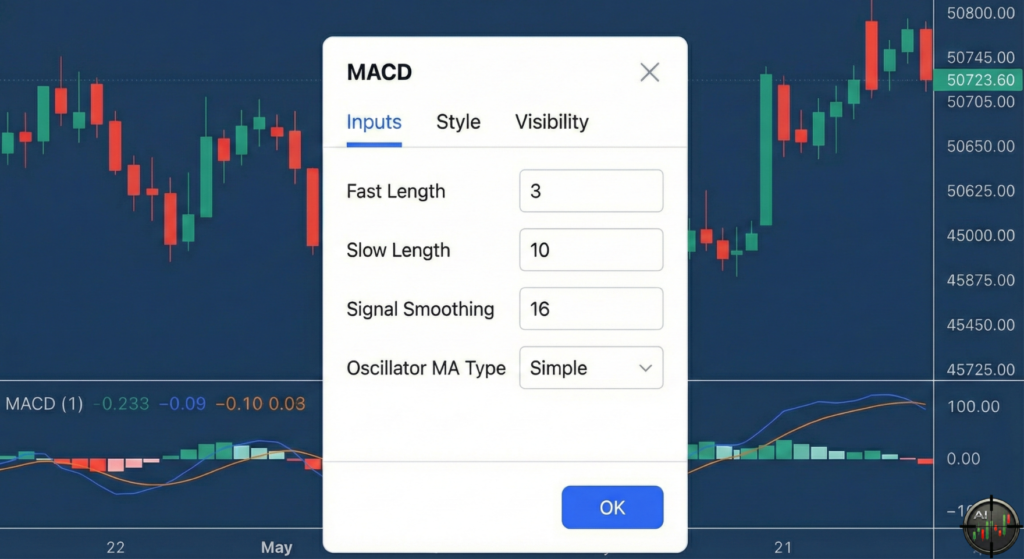
- Fast Length: Change to 3.
- Slow Length: Change to 10.
- Signal Smoothing: Change to 16.
- Oscillator MA Type: Ensure this is set to Simple (or SMA) for the signal line.
Once you’ve entered these values, click “OK” or “Apply” to finalize the setup. Your chart is now ready for the 3-10-16 MACD strategy.
Final Thought
The MACD (3, 10, 16) is not a magic bullet, but it is a high-performance weapon for day traders who feel the standard settings are too sluggish. By combining the reactive nature of the 3/10 EMAs with the smoothing of the 16 Signal, you get a reliable gauge of short-term market sentiment.
Start by backtesting this on your favorite pairs today. As always, manage your risk and never trade without a stop loss.